

Mädchen machen Technik 2017

"Mädchen machen Technik" is a summer program organized by the Technical University of Munich every year. School girls between 10 and 16 years old are invited to universities and departments to discover how exciting and challenging research in natural science and engineering can be.
On September 5th - 6th 2017, W2W offered a program called "Wind, Wetter und (Klima-)Wandel" for ten school girls between 12 and 14 years old. The participants learned about the diversity and complexity of atmospheric physics and dynamics. On the first day they made their own experiments thereby constructing a thermometer, producing clouds, and learning about temperature, pressure and convection. They then took part in lab experiments and learned about the foehn winds, the Coriolis force and convection in the atmosphere. At the end of the day they visited the roof instruments. On the second day they made their own weather chart and compared it to the current satellite animation. In the afternoon they produced a numerical weather prediction over Germany based on the article of Charlton-Perez and Dacre 2011 (link to the online article).
The program was fully booked within the first day after the registration had opened. The participants were motivated and interested. Their feedback was very positive: they enjoyed the experimental part as much as the weather forecasting part of the program and they were very happy to talk to the students (volunteers) about studying meteorology at the university and the everyday life at the institute.
The program (in German) is available here.
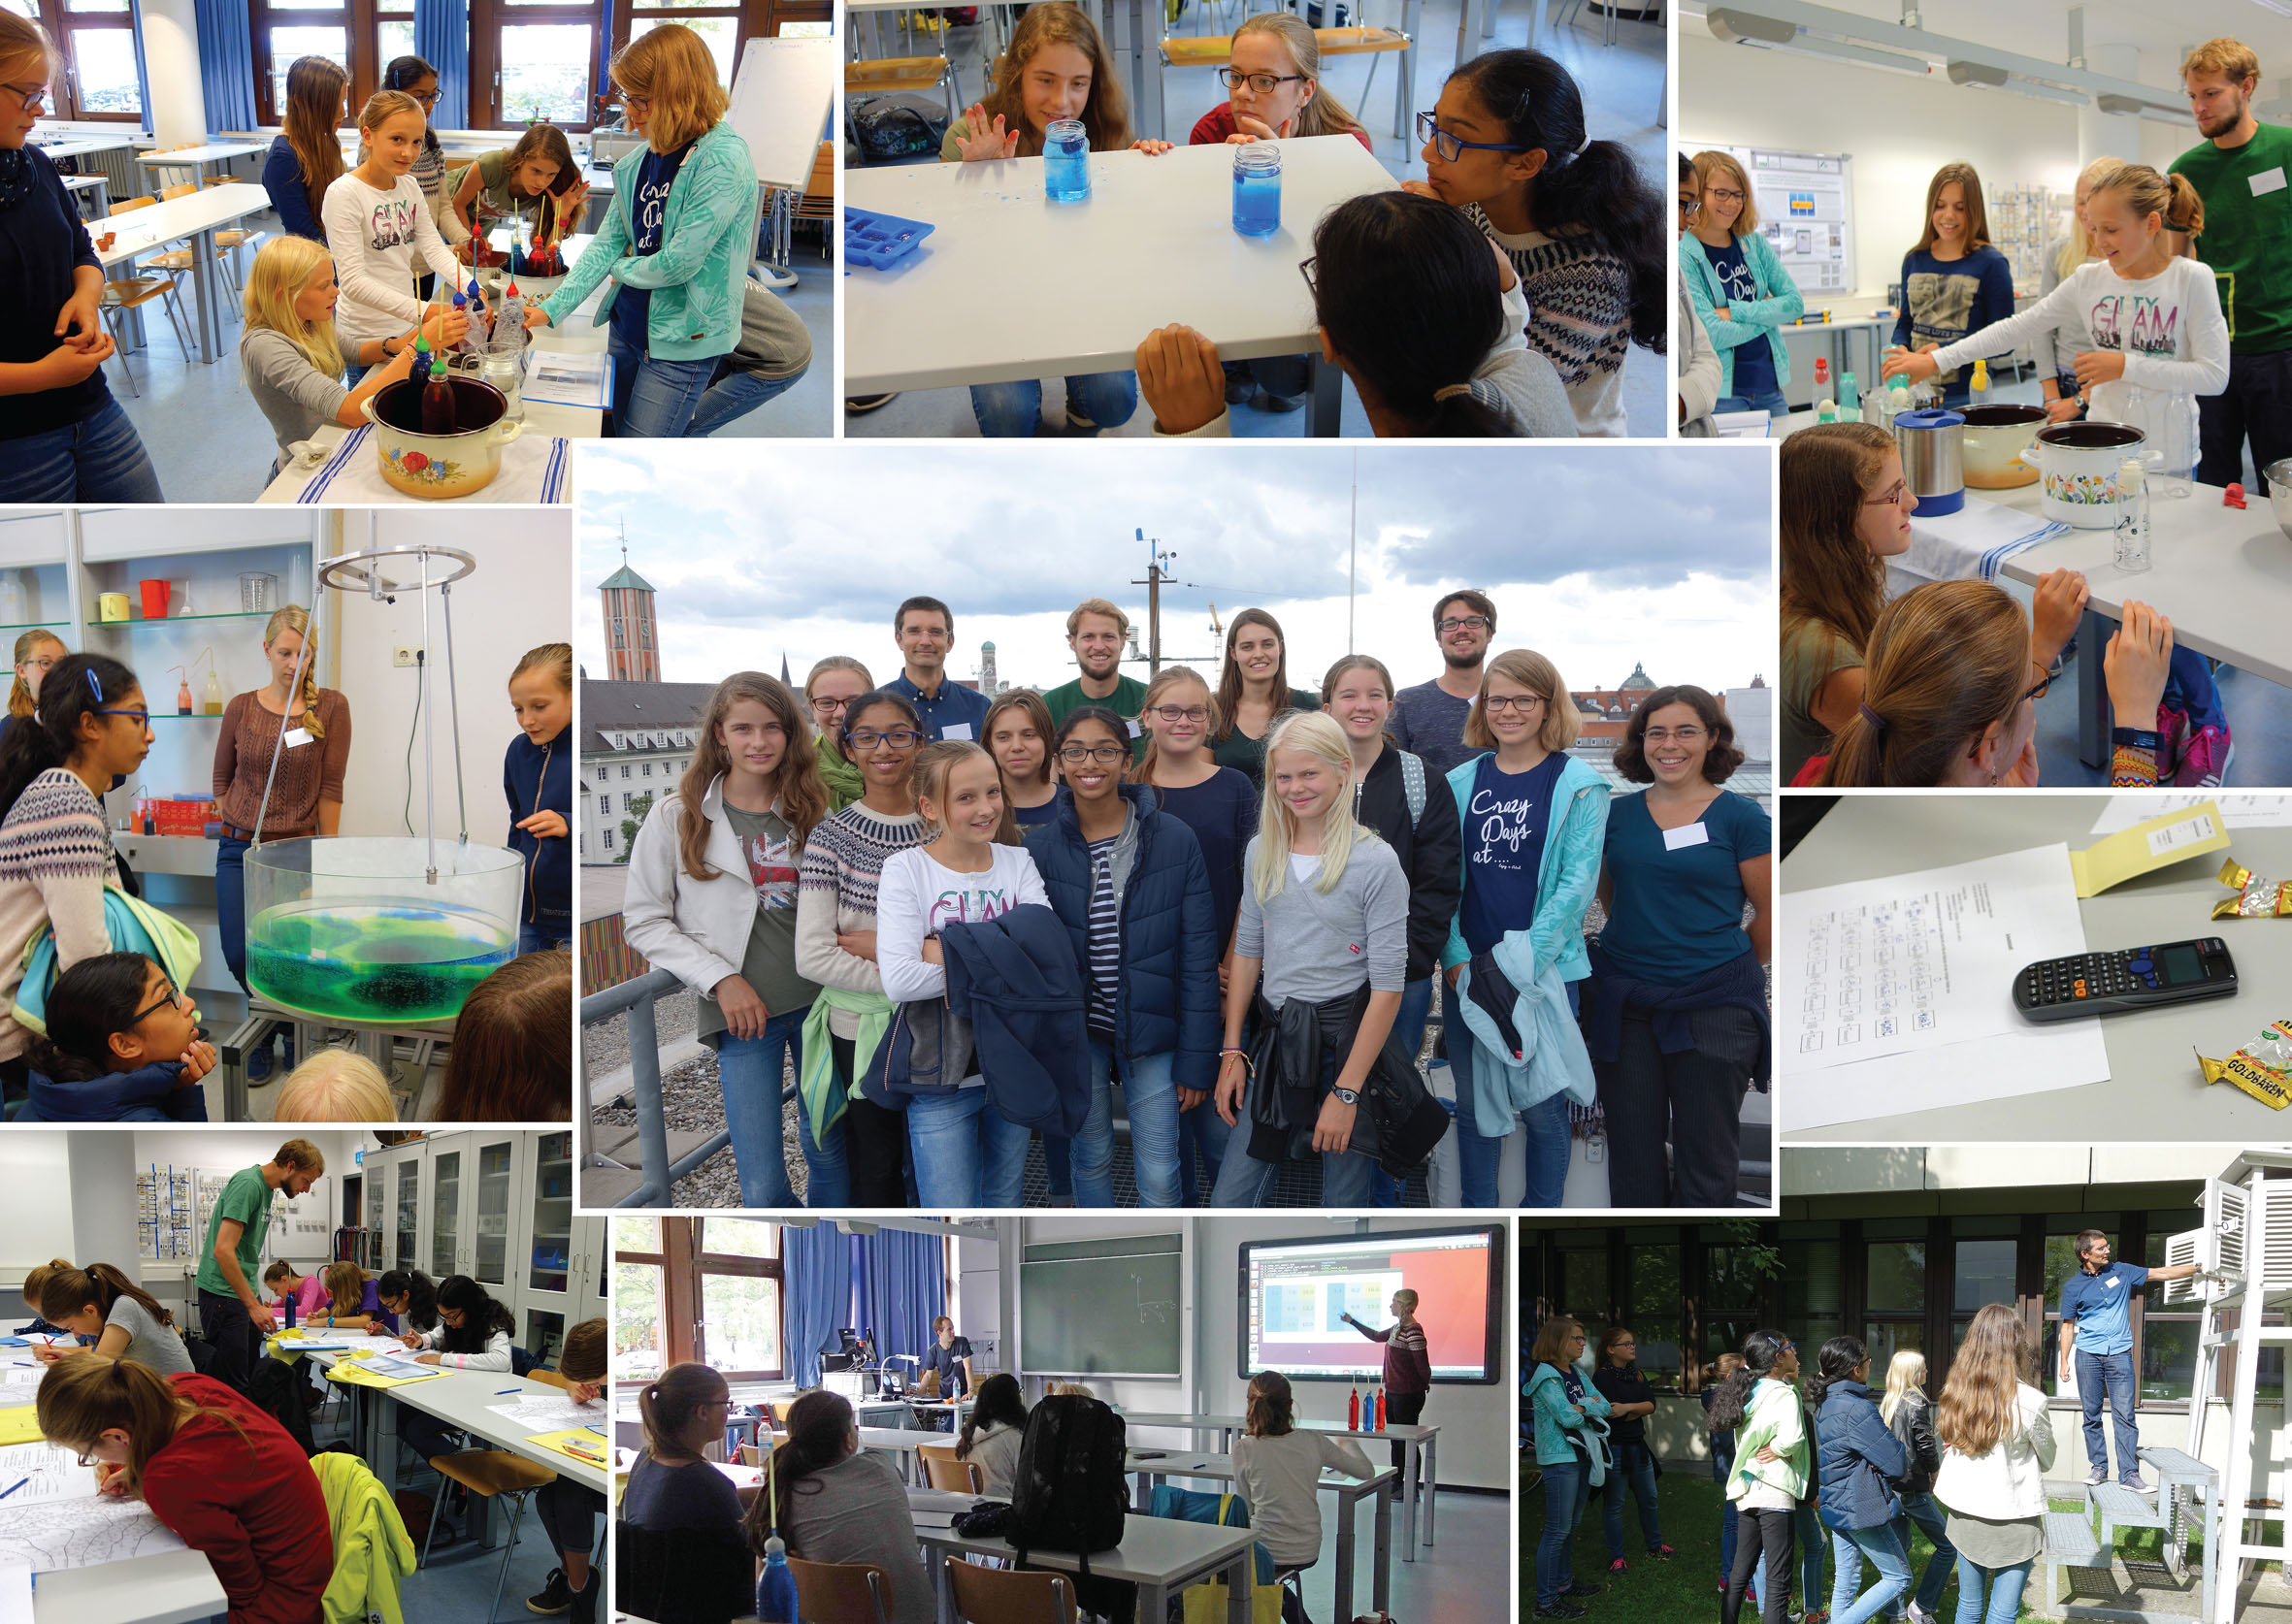 Center panel: group picture on the roof of the meteorological institute in Munich. Some of the activities are illustrated: constructing a thermometer (top left), learning about convection in a glass jar (top center), learning about air pressure with an egg and a bottle (top right), learning about the Coriolis force in the lab (center left), drawing a weather chart (bottom left), computing a numerical weather forecast (center right) and comparing it with model outputs (bottom center) and discovering the weather station of the institute (bottom right).